
The release of ricochet v0.6 stabilized support for Shiny for Python, rounding out our existing Shiny support across both R and Python.
To celebrate, we built a demo app (source) that showcases modern scalable geospatial visualization using lonboard from Development Seed. The app visualizes the King County housing sales dataset (~22k home sales) on an interactive map with filtering by price, bedrooms, bathrooms, and square footage.
The app is live on gallery.ricochet.rs and embedded below.
This blog post will discuss what makes lonboard so fast 🏎️💨.
TL;DR
- GeoJSON adds a ton bloat and is a real bottleneck
- Using “end-to-end binary data pipeline” provides meaningful speed ups
- GeoParquet results in smaller file sizes
- GeoArrow native represention results in 0 cost data transfer
Run the app locally
If you want to run the app directly, the source code for the app is in our repo ricochet-rs/test-apps.
Clone the example:
git clone --filter=blob:none --sparse https://github.com/ricochet-rs/test-apps.git
cd test-apps
git sparse-checkout set python/shiny-py-lonboard
cd python/shiny-py-lonboard
Install dependencies and run locally:
uv sync
uv run shiny run app.py
Status Quo
Interactive visualization of spatial data has traditionally been done using the library Leaflet (via folium in python and {leaflet} in R). There are other alternative such as pydeck and kepler.gl. The R community has also begun transitioning away from {leaflet} towards the newer and modern {mapgl}.
However, all of these libraries still suffer from the same bottleneck: GeoJSON. GeoJSON is an extension of JSON (JavaScript Object Notation). It is a pure text representation of spatial data. And frankly, text is not an efficient way to store spatial data—a shapefile is likely better.
There are two primary issues with GeoJSON:
- It is text which grows in size very quickly
- Data in GeoJSON needs to be parsed into an in-memory representation
- GeoJSON is row-based representation
(De)serialization
Converting an in memory object such as a data frame (e.g. GeoDataFrame or sf) to another format is called serialization.
Serializing to GeoJSON can be very slow. Going the other way—e.g. reading from a GeoJSON—is called deserialization.
This is, in most cases, even slower.
Most browser-based mapping tools (Leaflet, MapLibre, pydeck, etc) require your data to arrive as GeoJSON.
This results in a workflow like so:
flowchart LR
A[GeoDataFrame] --> B[GeoJSON]
B --> C[Send to the browser]
C --> D[Parse the GeoJSON]
D --> E[Render]
The (de)serialization steps take up the bulk of the time.
The whole workflow is fraught. Serializing a GeoDataFrame toe GeoJSON is slow. The string itself is large. Parsing it in the browser is slow. For small datasets, this isn’t very noticable. However, when working with detailed geometries or large datasets, that round-trip becomes a huge bottleneck.
Lonboard’s special sauce is that it uses an “end-to-end binary data pipeline” skipping GeoJSON entirely.
Lonboard’s innovations
There are 3 major innovations to lonboard that make it so powerful:
- Lonboard uses GeoParquet instead of GeoJSON
- Data is stored as GeoArrow in memory
- It uses deck.gl, a GPU powered renderer
By relying on GeoParquet and GeoArrow throughout the entire pipeline, lonboard avoids expensive (de)serialization costs every step of the way.
GeoParquet
Lonboard eliminates the text serialization entirely by leaning on GeoParquet. GeoParquet is an extension to the Parquet file format, which is itself a compressed binary columnar format. Instead of sending a multi-megabyte string across the wire and then parsing it, lonboard sends the GeoParquet file as binary.
The workflow looks like this:
flowchart LR
A[GeoDataFrame] --> B[Write to GeoParquet]
B --> C[Send to the browser]
C --> D[Read with parquet-wasm]
D --> E[Pass directly to deck.gl]
According to the lonboard docs:
Saving GeoArrow to Parquet was 135x faster than saving a GeoDataFrame to GeoJSON. The resulting file was 26x smaller. And parsing the Parquet to Arrow on the frontend was 5.6x faster than
JSON.parse.
The format yields speedups orders of magnitude faster than we could achieve with GeoJSON. This change makes it possible to ship datasets to the browser that were previously off the table.
GeoArrow
The real benefit that we get from GeoParqeut comes from the usage of GeoArrow. GeoArrow is an extension of the Apache Arrow (Arrow for short) specification. Arrow specifies how data should be represented in memory. Arrow is a columnar storage format.
Row vs. Column Storage
GeoJSON and even other more efficient formats like FlatGeoBuf are not designed for analytical workflows. These file formats store each row of data together. For example, to calculate the average of a single column, each row has to be read and every value except the one from the column of interest is discarded. Columnar formats store each variable together. Doing so make it so that only columns can be accessed without having to sift through every single row of a dataset.
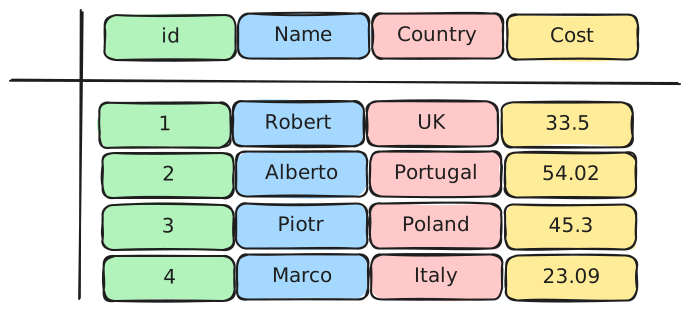
Diagram from the Apache Arrow columnar format specification
Arrow is a standard and not a library. The benefit of this is that Arrow data can be sent between tools / languages / runtimes without incurring a (de)serialization cost enabling “seamless” interoperability.
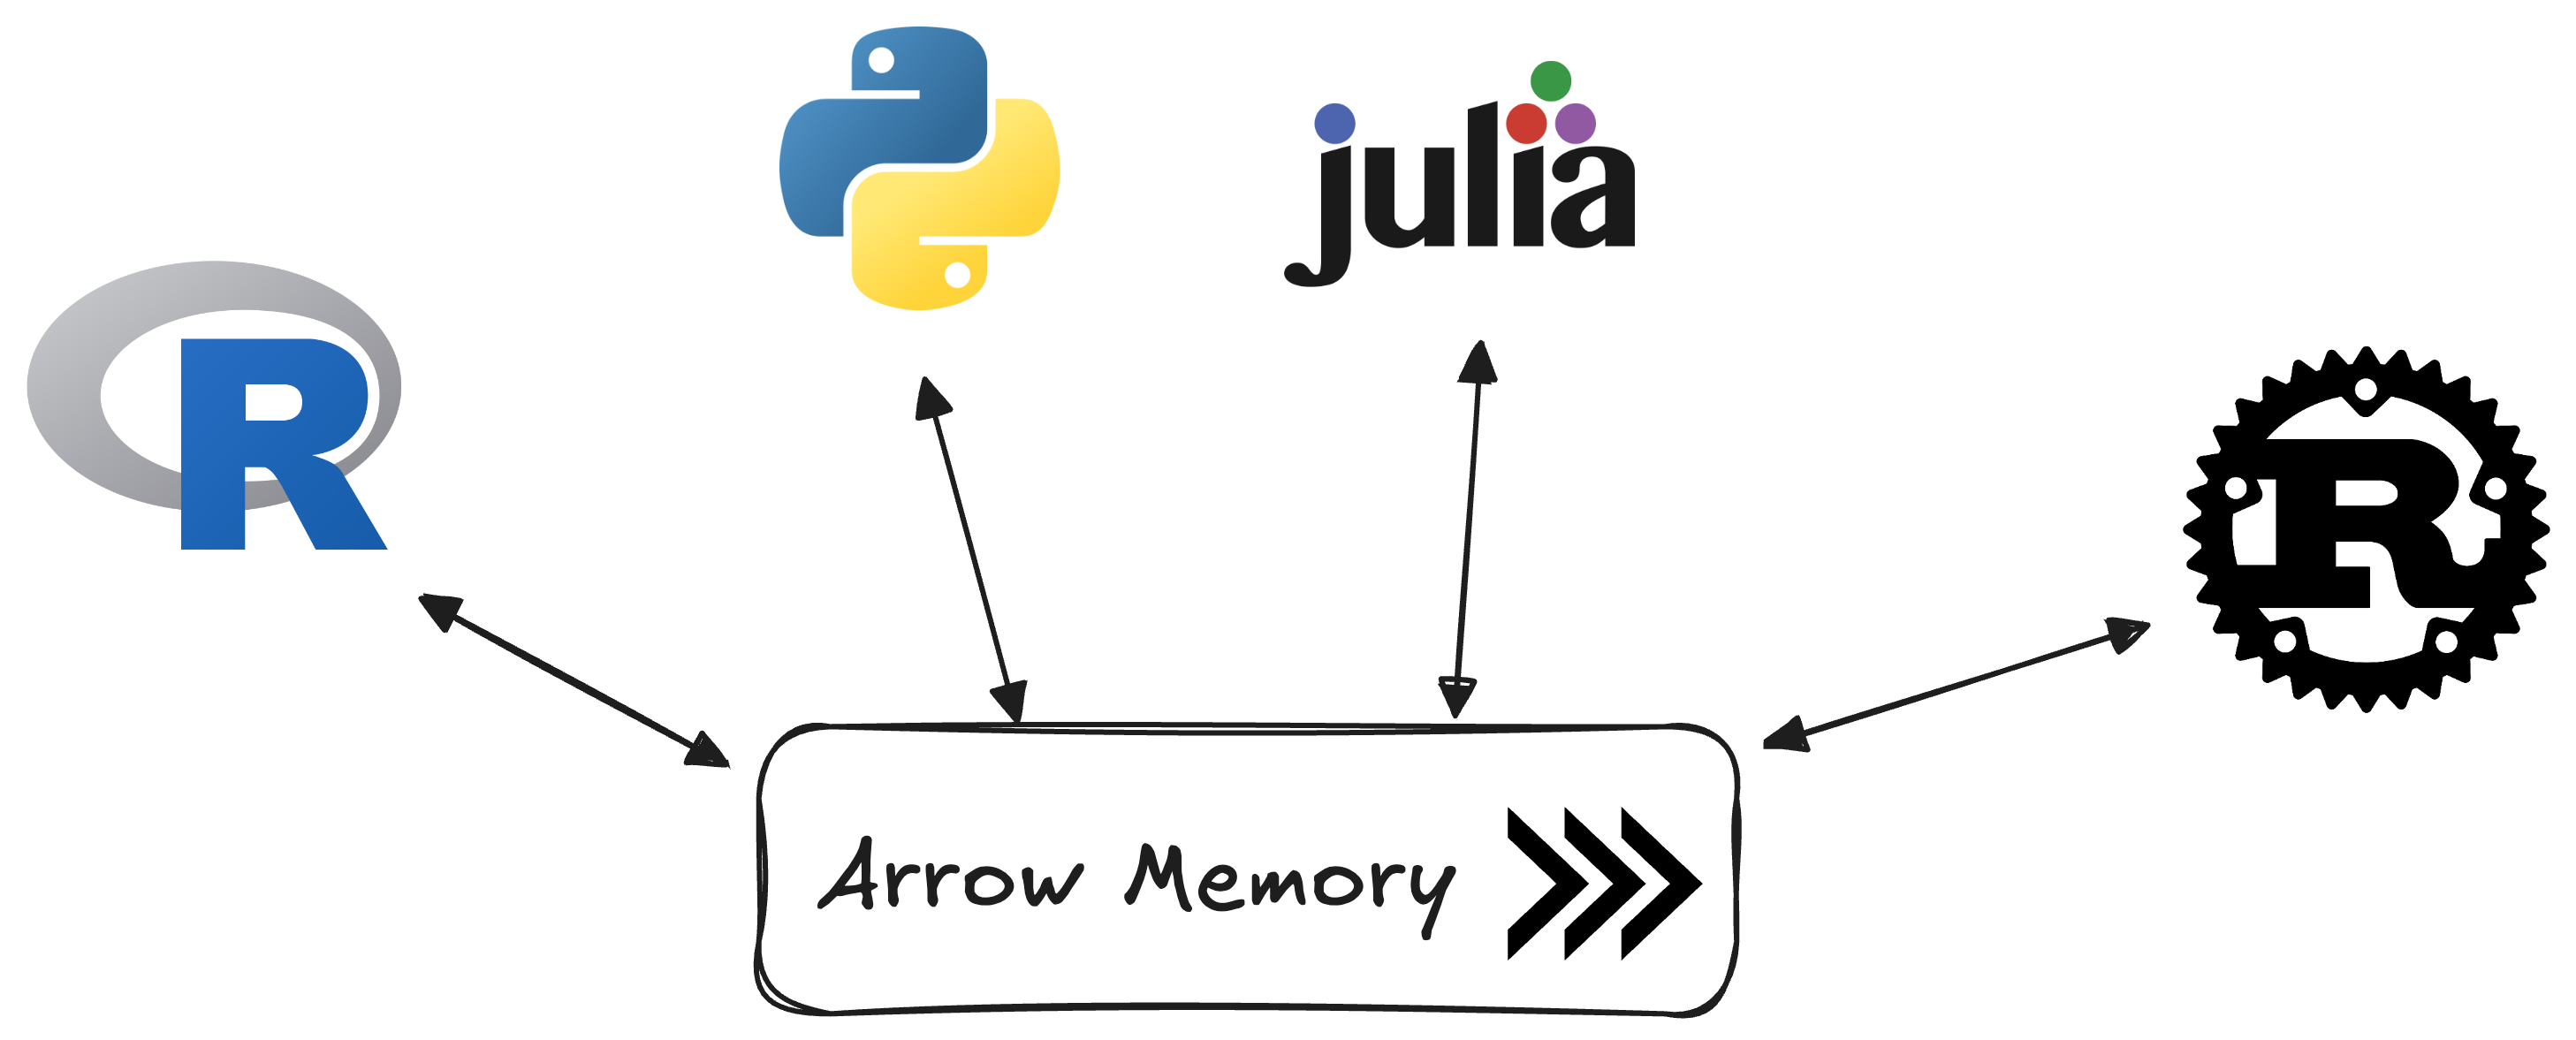
Diagram from Apache Arrow, Rust, and cross-language data science
GeoArrow builds upon the Arrow specification to create a standard for how spatial data shuold be represented in memory. Meaning any tool that can use GeoArrow can use the same data—i.e. GeoArrow from Python can be used by geoarrow-r or {nanoarrow}.
GeoArrow 🤝 GeoParquet
The GeoParquet 1.1 release added support for native GeoArrow encoding. When geometry is stored in native GeoArrow format inside a Parquet file, the browser can read the file and access the geometry directly without converting the data to GeoArrow.
deck.gl, the tool used by lonboard, has an extension that supports the use of native GeoArrow. Thus, coupling GeoParquet and native GeoArrow enables transferring data from disk to GPU without any intermediate format.
Parquet and the browser
The remaining piece is parquet-wasm, which reads the GeoParquet file in the browser via WebAssembly.
WebAssembly (Wasm) is an instruction format that lets you run code written in languages like Rust or C++ inside the browser at near-native speed. parquet-wasm uses WASM to read Parquet files directly in the browser, so the data never has to be converted out of its native format before reaching deck.gl.
GPU rendering
The first hurdle is improving data transfer and storage. The second one is actually where the rendering happens. Over the past few years, Graphics Processing Units (GPUs), have become incredibly powerful and, up until recently, affordable. Libraries like Leaflet render each and every polygon and point using the CPU. That works fine for a few hundred or even thousands of features. But the scale and efficiency that the GPU provides far exceeds what is possible from the CPU.
Lonboard renders it’s map via deck.gl, which runs on WebGL. WebGL, in overly simplistic terms, pushes web rendering to the GPU.
DeckGL and GeoArrow
The piece that ties this all together is @geoarrow/deck.gl-geoarrow. It is a small “glue library” that lets deck.gl consume GeoArrow data.
deck.gl-geoarrow copies data from an Arrow JS RecordBatch directly to the GPU.
The “full” internal machinery can be simplified as:
- Convert to GeoParquet
- Send GeoParquet to the browser
- Use
parquet-wasmto read into Arrow Table deck.gl-geoarrowaccesses underlying arraysdeck.glrenders in the browser
Building the Shiny app
Since lonboard integrates with Jupyter Widgets via anywidget, it works in Shiny for Python through shinywidgets with minimal glue code. The @render_widget decorator drops the map directly into the UI:
@render_widget
def map():
    return Map(
        layers=[layer],
        view_state={
            "longitude": -122.2,
            "latitude": 47.5,
            "zoom": 9,
        },
        show_side_panel=False,
    )
Efficient Filtering
Transferring data is where much of the bottleneck comes from.
When adding interactivity, it’s critical that data only be sent once.
Recreating the widget sends the full dataset from Python to the browser.
Lonboard’s DataFilterExtension solves this by moving filtering to the GPU.
It sets the filter range inside of the browser and, critically, does not re-render the widget with the subsetted data.
@reactive.effect
def _update_filter():
    layer.filter_range = [
        [input.price_min(), input.price_max()],
        [BED_CHOICES[input.bedrooms()], BEDS_MAX],
        [BATH_CHOICES[input.bathrooms()], BATHS_MAX],
        [input.sqft_min(), input.sqft_max()],
    ]
This ensures that the map doesn’t re-render.
Progress in the R-ecosystem
The R Consortium funded active work on new R packages that bring similar capabilities to the R ecosystem from Tim Appelhans.
geoarrowWidget is an extension to {htmlwidgets} that simplifies transfering data from a file or URL to any other htmlwidget.
The package also ensures that the requisite JavaScript dependencies are also available—including Arrow JS and parquet-wasm.
deckglgeoarrow, on the otherhand, is an extension to {mapgl} that wraps deck.gl-geoarrow enabling conversions from common spatial formats such as sf, wk, geos, and terra, to GeoArrow.
Deploy to ricochet
Install the CLI, add the server, and deploy:
curl -fsSL https://raw.githubusercontent.com/ricochet-rs/cli/main/install.sh | sh
ricochet servers add try https://try.ricochet.rs
ricochet login -S try
ricochet deploy